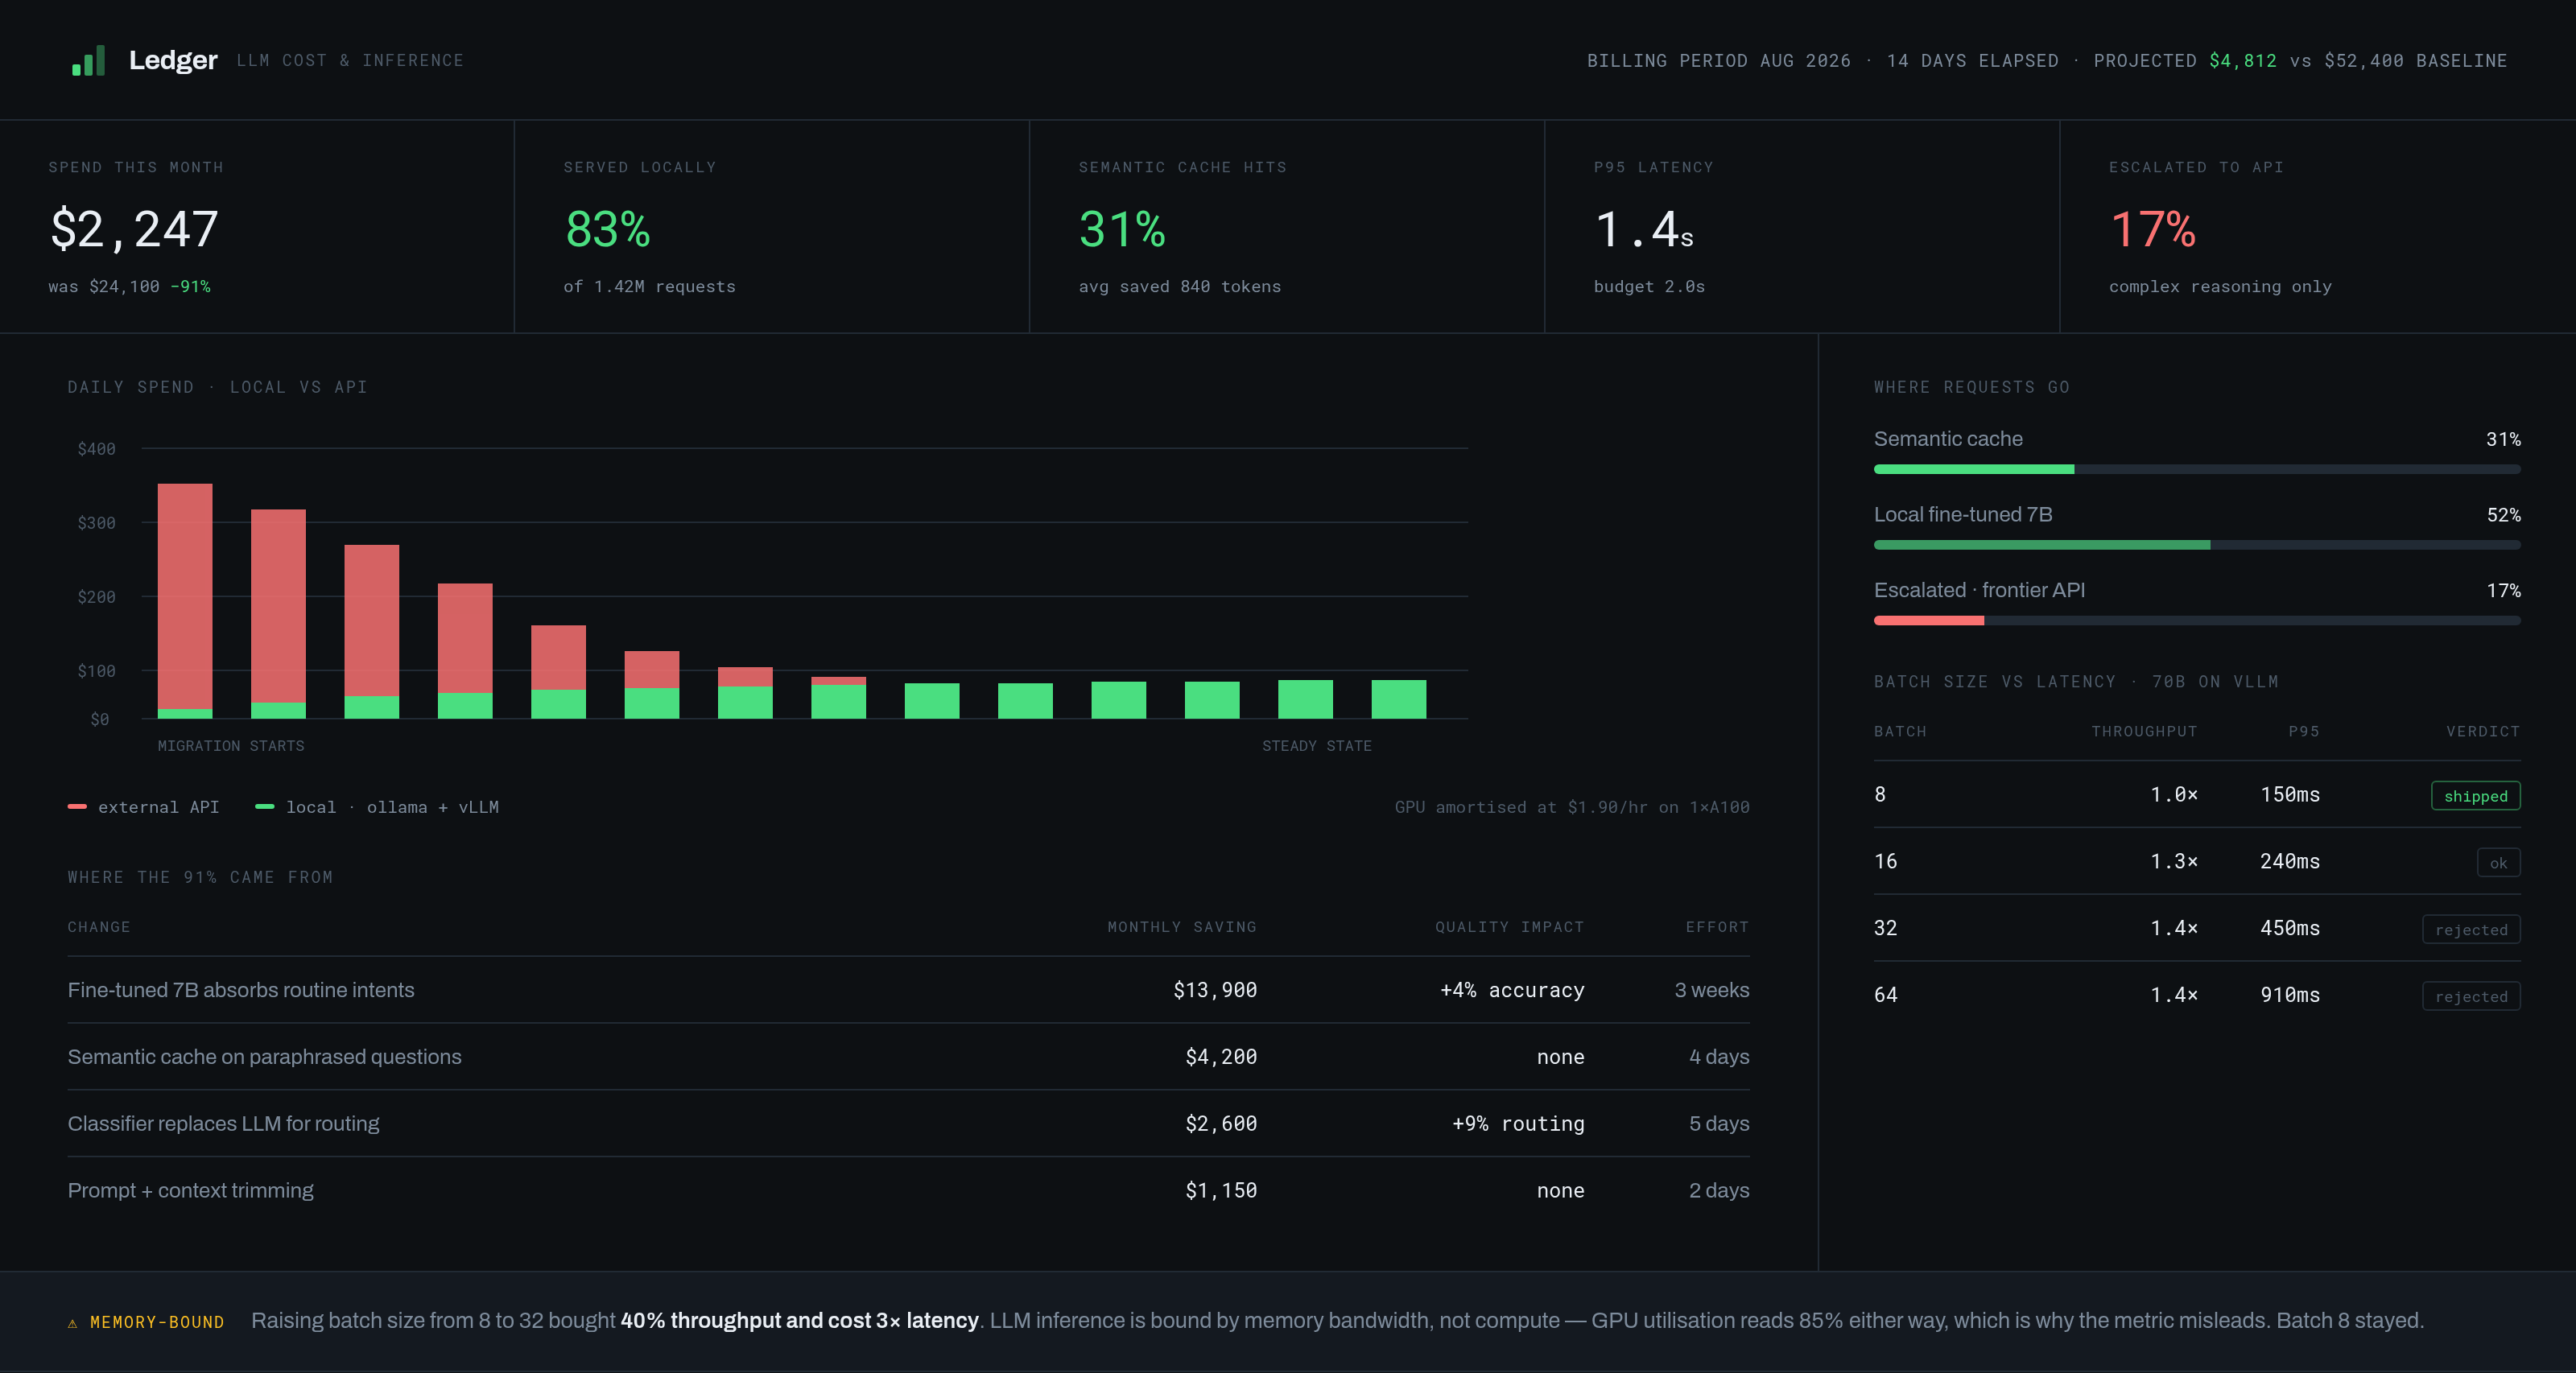
Inference bills are rarely reduced by one big decision. They come down through four changes with very different effort-to-saving ratios, and doing them in the wrong order wastes weeks.
What the dashboard needs to show
- —Spend split by local versus hosted, per day — the trend line that shows migration working.
- —Semantic cache hit rate, and average tokens saved per hit.
- —Where each request went: cache, local model, or escalated.
- —p95 latency against your budget, not average latency.
- —Batch size versus latency, so the trade is visible rather than assumed.
The order that pays
01Route by difficultyDays of work. Simple intents never reach a frontier model.
02Semantic cachingDays of work. Catches paraphrases that string caching misses entirely.
03Replace LLMs doing pattern matchingDays of work. Classification and extraction rarely need a language model.
04Fine-tune a local modelWeeks of work, and the largest single reduction — but only once you have the volume to justify it.
The first three are quick and reversible, so they should happen before the expensive one. Together this sequence can take a bill down by an order of magnitude — but the honest framing is that most of the early saving comes from not calling a model at all.